UK MVL Statistics 2026 and Tax Event Analysis5

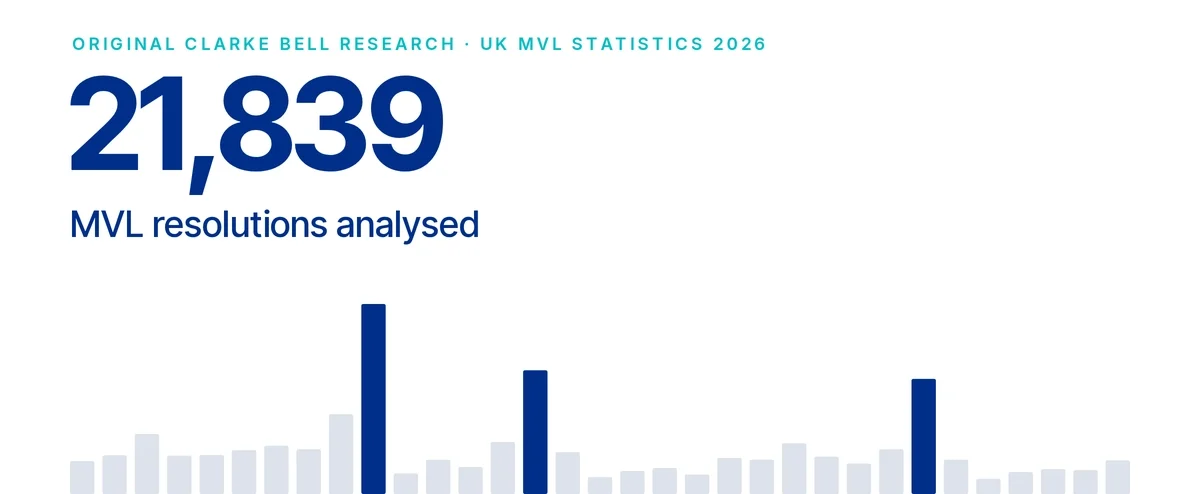
These Members’ Voluntary Liquidation (MVL) statistics are based on an analysis of 21,839 individual resolutions, making this one of the largest published studies of UK MVL activity.

The research looks at what happened around three major tax events. Before the 2024 Autumn Budget and the 2025 and 2026 BADR increases, activity rose sharply, then dropped by 93% to 94% immediately afterwards.

A separate 3,100-resolution 2023 dataset provides an important comparison. The result is a detailed picture of how MVL activity changes over time, alongside the latest figures on BADR, costs, duration and shareholder outcomes.

Key UK MVL statistics

Statistic Latest finding
Confirmed resolutions in Clarke Bell study 21,839
Separate 2023 comparison dataset 3,100
UK MVLs in FYE 2026 8,569
Annual change in UK MVLs -31.9%
5 days before the 2024 Autumn Budget 1,092 resolutions
Fall immediately after the 2024 Budget 93%
Pre-2025 BADR activity 6.83x January level
Fall immediately after the 2025 BADR rise 94%
Pre-2026 BADR activity 6.41x January level
Fall immediately after the 2026 BADR rise 93%
Median completed MVL duration 478 days
Median MVL cost 1.8% of assets realised
Eligible completed MVLs with full creditor recovery 99.8%

About this data: Clarke Bell analysed 21,839 confirmed UK MVL resolutions from January 2024 to September 2026. This page also brings together the latest official statistics on MVL volumes, BADR, costs and outcomes.

How do tax changes affect MVL activity?

Clarke Bell analysed 21,839 UK Members’ Voluntary Liquidation resolutions to examine activity around the 2024 Autumn Budget and the 2025 and 2026 BADR increases. The study compares what happened before and after each event, alongside control periods.

Do MVLs increase before tax changes?

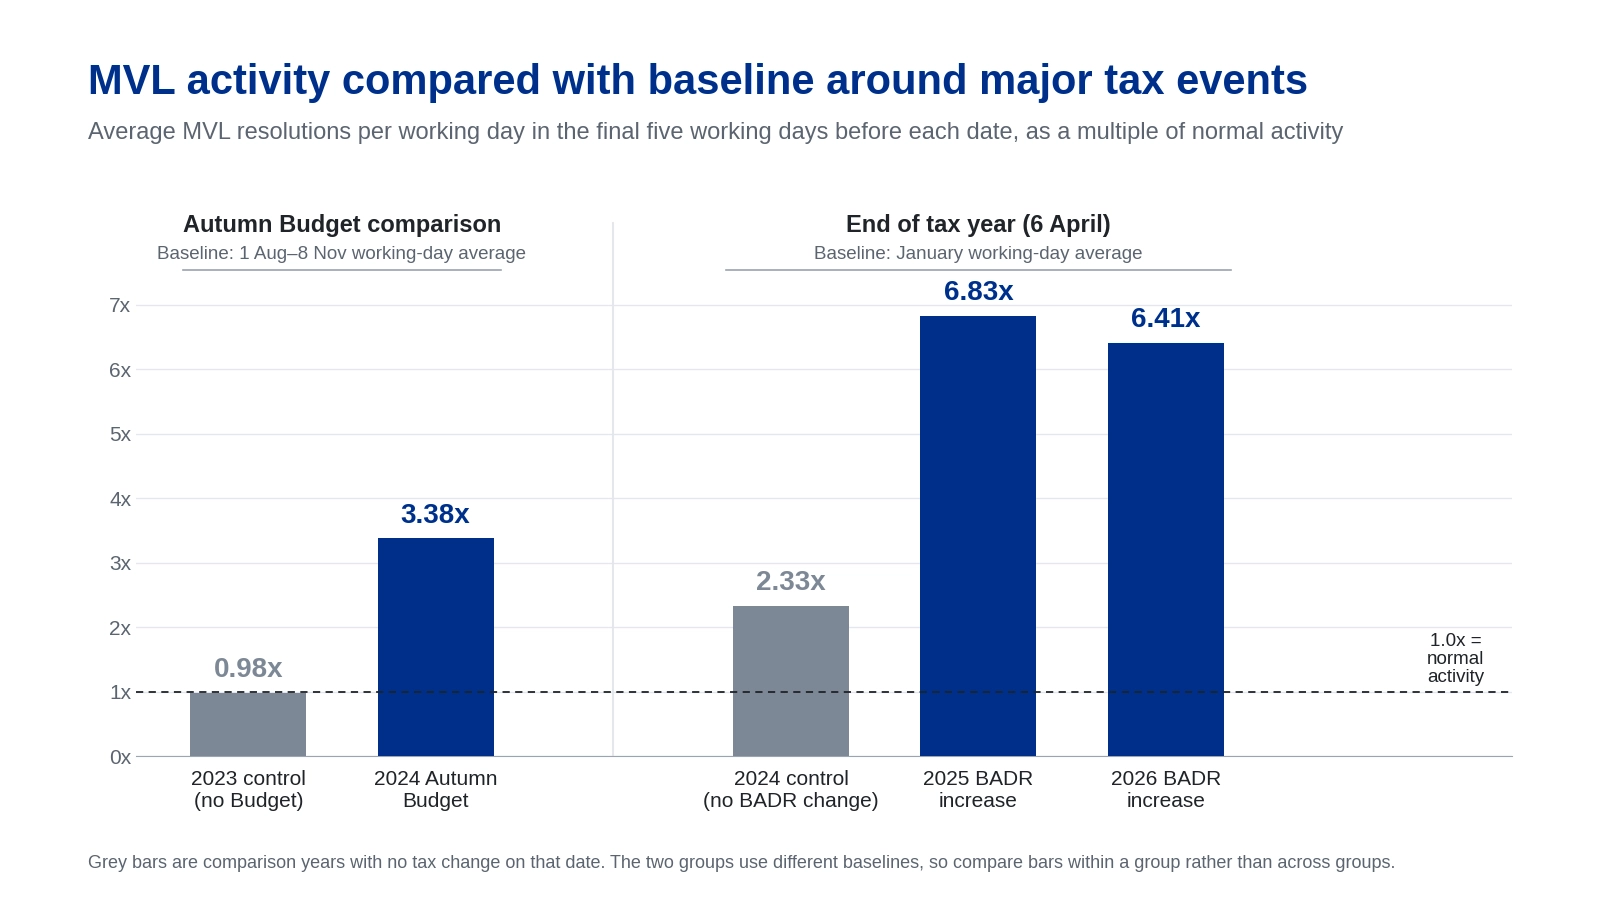
Yes. Our analysis found that MVL activity increased sharply in the final 5 working days before each of the three recent UK tax events. Average daily activity reached 3.38 times baseline before the 2024 Autumn Budget, 6.83 times January levels before the 2025 BADR increase and 6.41 times January levels before the 2026 BADR increase.

What happens to MVLs after tax changes?

In all three events studied, MVL activity fell by more than 90% immediately afterwards.

Resolutions fell 93% after the 2024 Autumn Budget, 94% after the 2025 BADR increase and 93% after the 2026 BADR increase, comparing the final 5 working days before each event with the first 5 working days from or after it.

What happened to MVLs before the 2024 Autumn Budget?

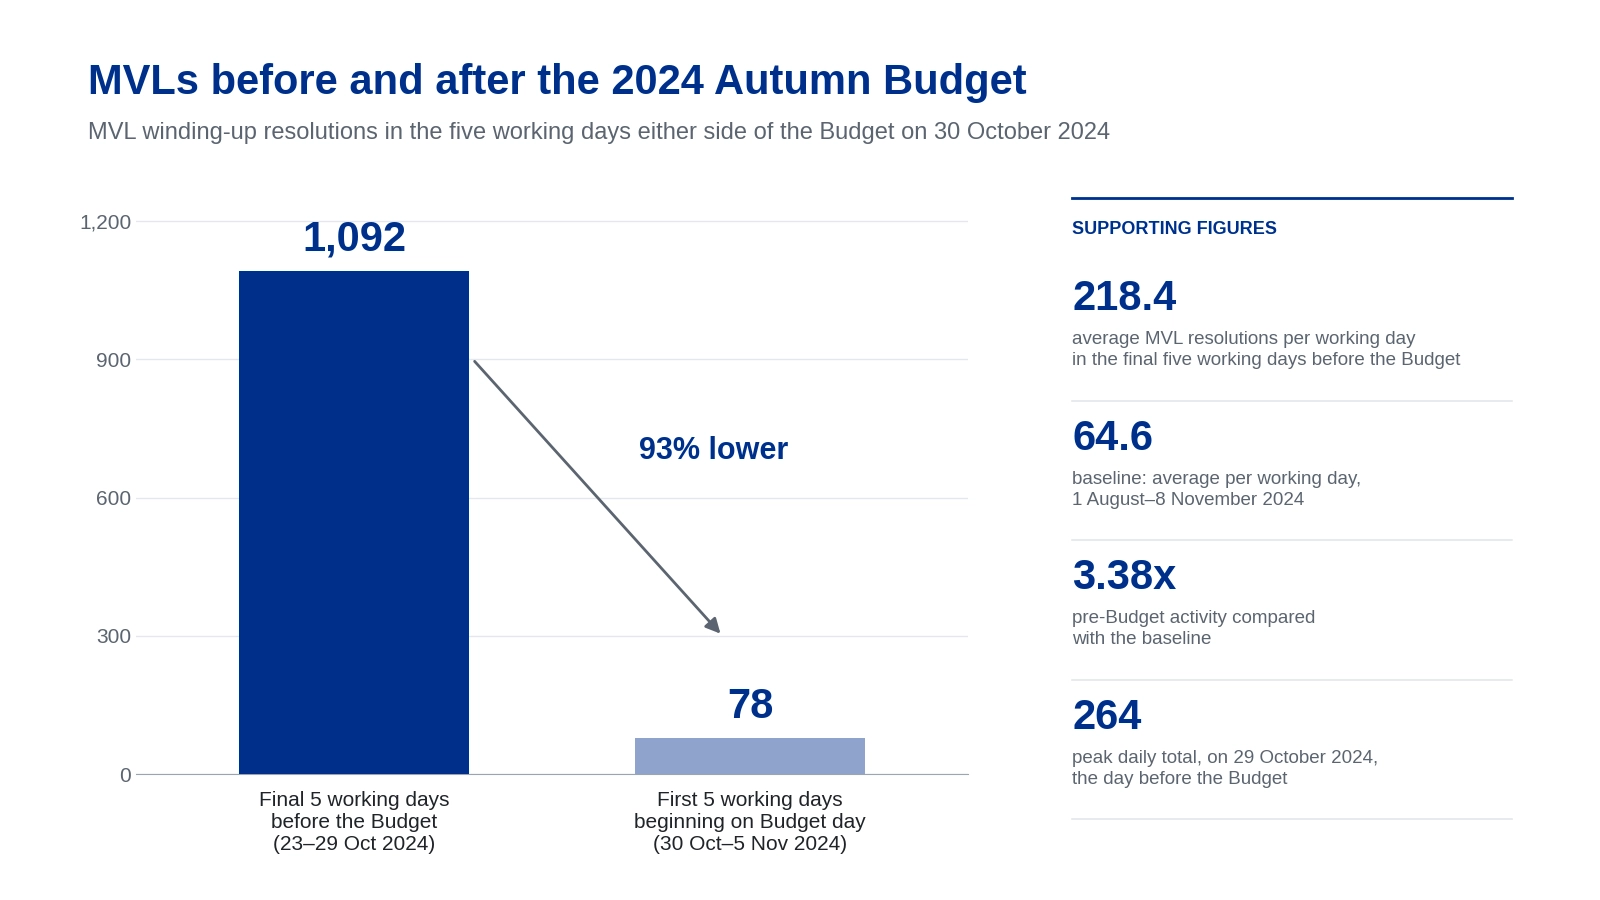
MVL activity rose sharply before the 2024 Autumn Budget. 1,092 winding-up resolutions were passed in the final 5 working days before 30 October 2024, compared with just 78 in the 5 working days beginning on Budget day, a fall of 93%.

Pre-Budget activity averaged 218.4 resolutions per working day, which was 3.38 times the August to November baseline of 64.6 per day.

The busiest single day was 29 October 2024, when 264 MVL resolutions were passed.

The same pattern did not appear in the equivalent late-October period in 2023, when activity was 0.98 times baseline.

Did MVLs spike before the 2025 BADR increase?

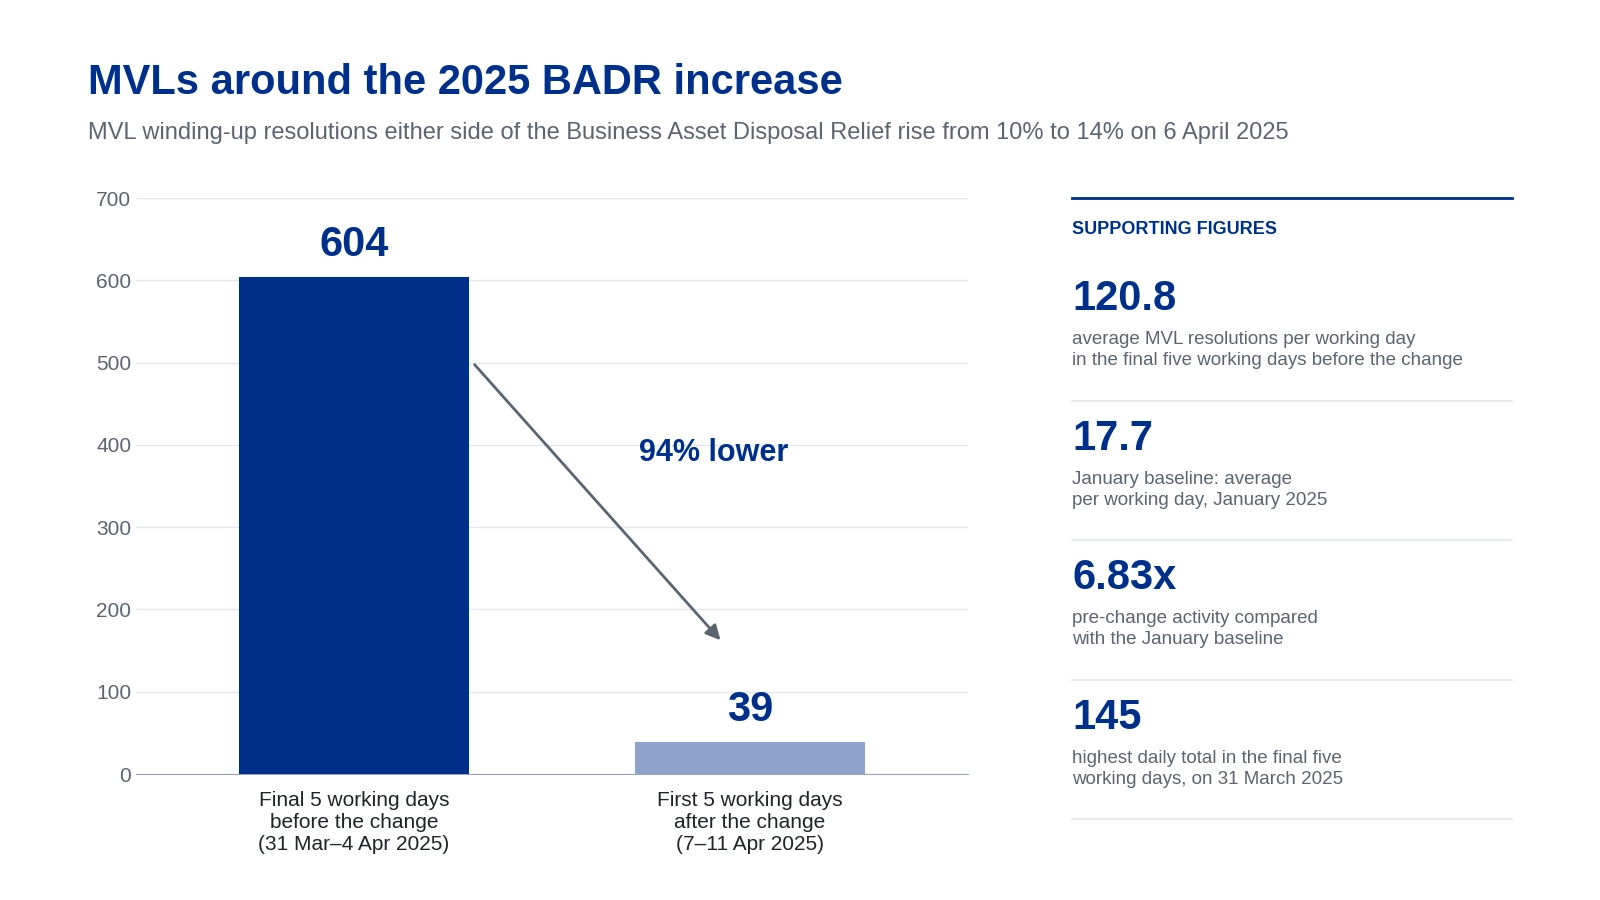
Yes. 604 MVL winding-up resolutions were passed in the final 5 working days before Business Asset Disposal Relief increased from 10% to 14% on 6 April 2025.

That compares with just 39 resolutions in the first 5 working days afterwards, a 94% fall.

Pre-change activity averaged 120.8 resolutions per working day, which was 6.83 times the January 2025 baseline of 17.7 per day.

The busiest day was 31 March 2025, when 145 MVL resolutions were passed.

Did MVLs spike before the 2026 BADR increase?

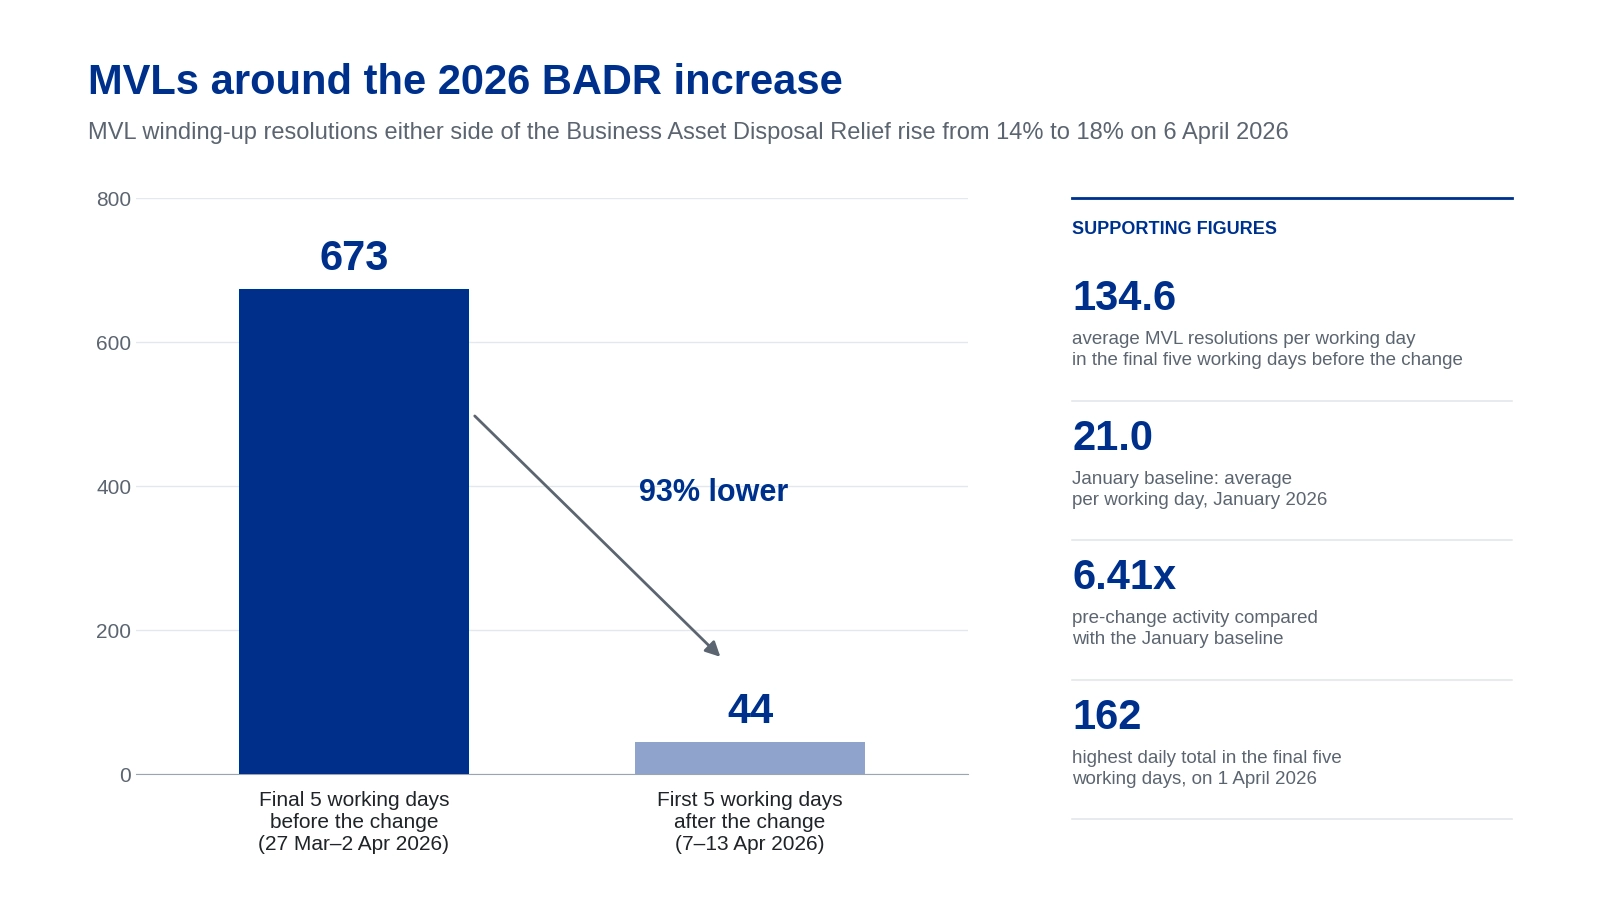
Yes. 673 MVL winding-up resolutions were passed in the final 5 working days before Business Asset Disposal Relief increased from 14% to 18% on 6 April 2026.

That compares with just 44 resolutions in the first 5 working days afterwards, a 93% fall.

Pre-change activity averaged 134.6 resolutions per working day, which was 6.41 times the January 2026 baseline of 21.0 per day.

Is there normally an end-of-tax-year spike in MVLs?

Yes. MVL activity normally rises around the end of the tax year, but the increase was much larger in the two years when BADR rates changed.

In the final 5 working days before 6 April 2024, when BADR did not change, activity reached 2.33 times the January average.

That compares with 6.83 times January levels before the 2025 BADR increase and 6.41 times before the 2026 increase.

This suggests normal tax-year-end seasonality explains some of the increase, but not the full scale of the spikes seen in 2025 and 2026.

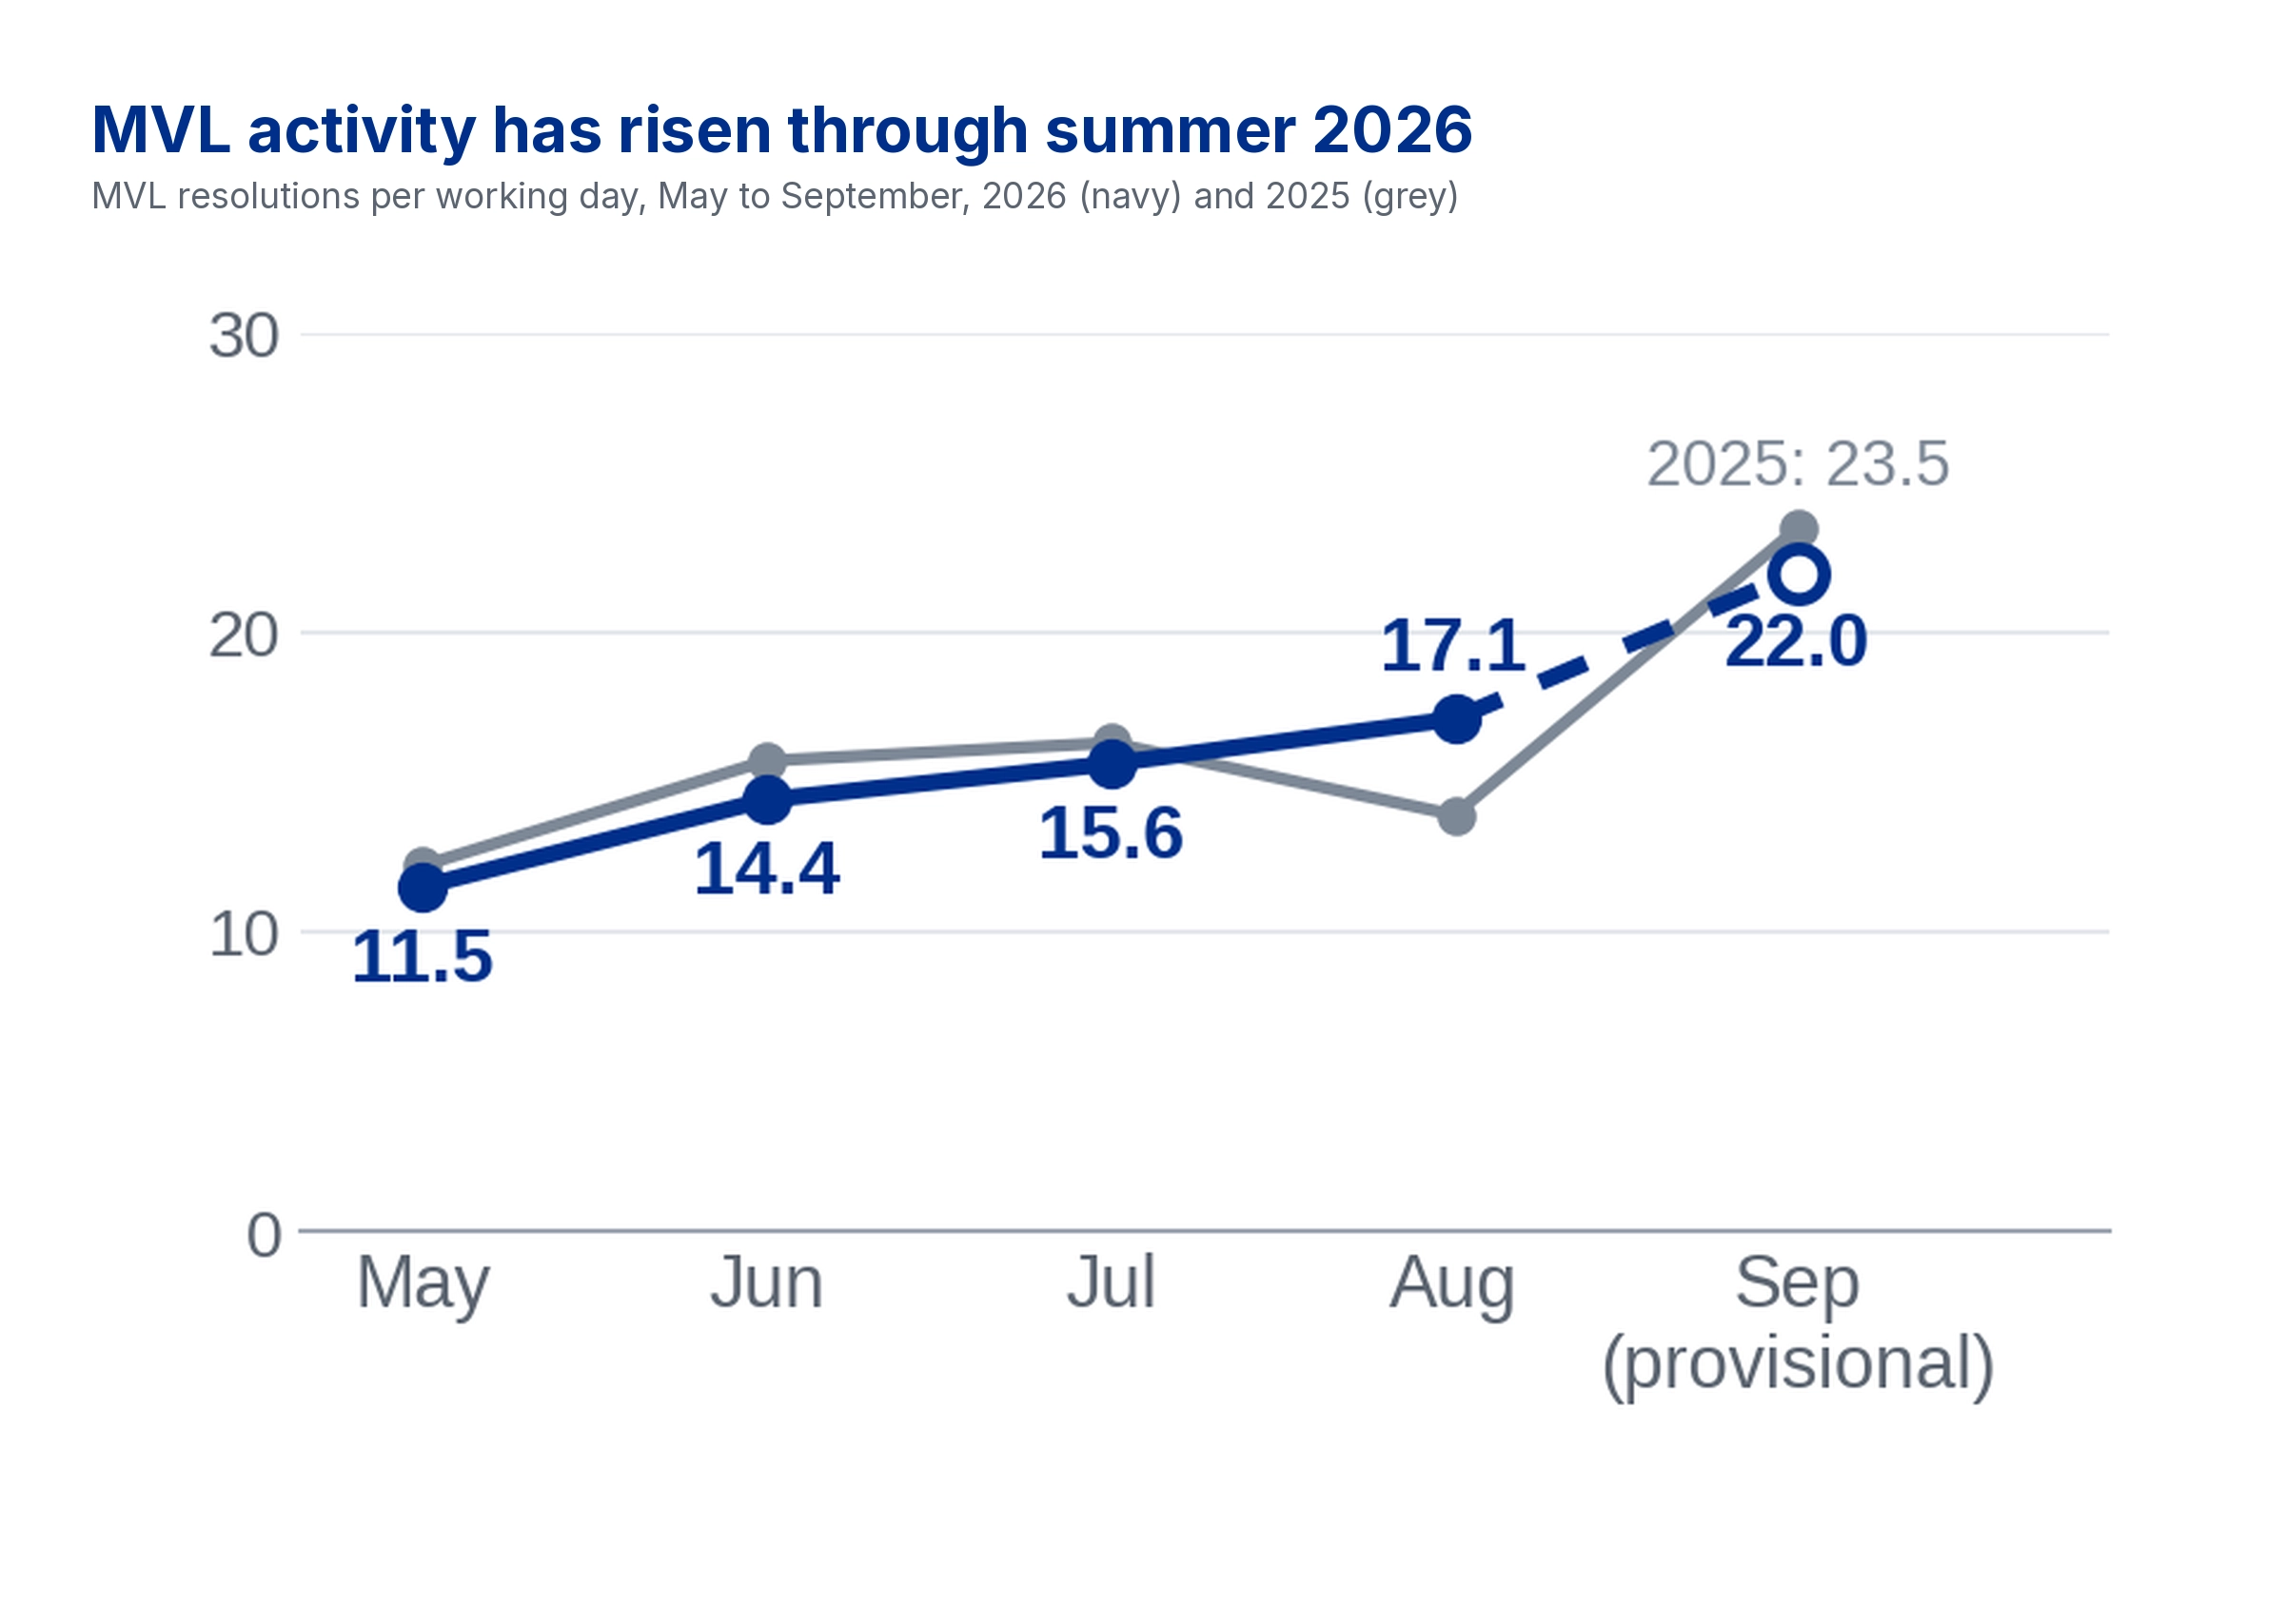
MVL activity increased steadily through summer 2026, with confirmed resolutions rising from an average of 11.5 per working day in May to a provisional 22.0 per working day in September.

September remains provisional because recent resolutions may not yet have been published. The median delay between a resolution being passed and its publication is 7 days, so the September figure may rise as further notices are published.

Have previous UK tax changes coincided with MVL spikes?

Yes. MVL activity rose sharply around tax changes introduced in 2016. The UK recorded 2,663 Members’ Voluntary Liquidations in March 2016, followed by 1,887 in April, before falling to 543 in May.

MVLs accounted for 66.2% of all company liquidations in March 2016. Tax rules affecting distributions from solvent liquidations changed from 6 April 2016.

Why do MVLs increase before tax changes?

Clarke Bell’s data cannot establish why an individual shareholder chose to liquidate. However, the timing shows substantially higher MVL activity immediately before the 2024 Autumn Budget and the 2025 and 2026 BADR changes than during the relevant baseline periods.

UK Members’ Voluntary Liquidation statistics

This section brings together the latest Members’ Voluntary Liquidation statistics, covering annual volumes, recent trends and where MVLs are most common across the UK.

How many MVLs were there in the UK in 2026?

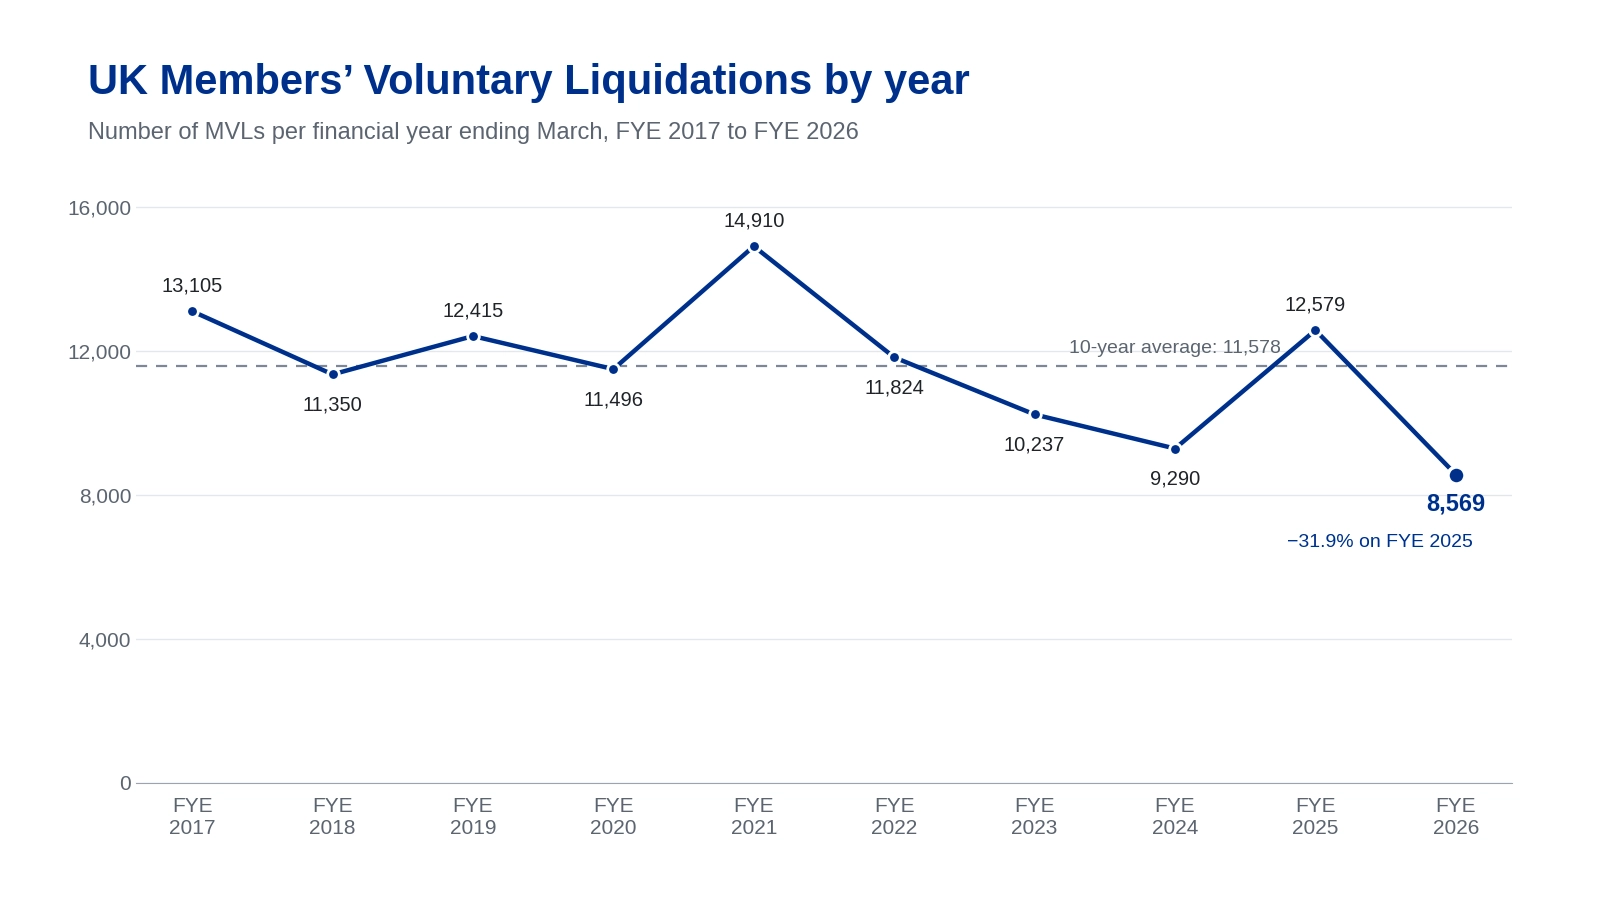
There were 8,569 Members’ Voluntary Liquidations in the UK in the financial year ending March 2026, down 31.9% from 12,579 the previous year.

Over the latest 10-year period from FYE 2017 to FYE 2026, the UK recorded 115,775 MVLs, averaging approximately 11,578 per year.

Are MVLs increasing or decreasing in the UK?

UK Members’ Voluntary Liquidations fell 31.9% in FYE 2026, following a 35.4% increase in FYE 2025. Annual MVL volumes have ranged from a 10-year high of 14,910 in FYE 2021 to a low of 8,569 in FYE 2026.

When were MVLs highest in the UK?

Across the latest 10-year series, the highest annual number of Members’ Voluntary Liquidations was 14,910 in FYE 2021. The lowest annual total in the same series was 8,569 in FYE 2026.

Where do most UK MVLs take place?

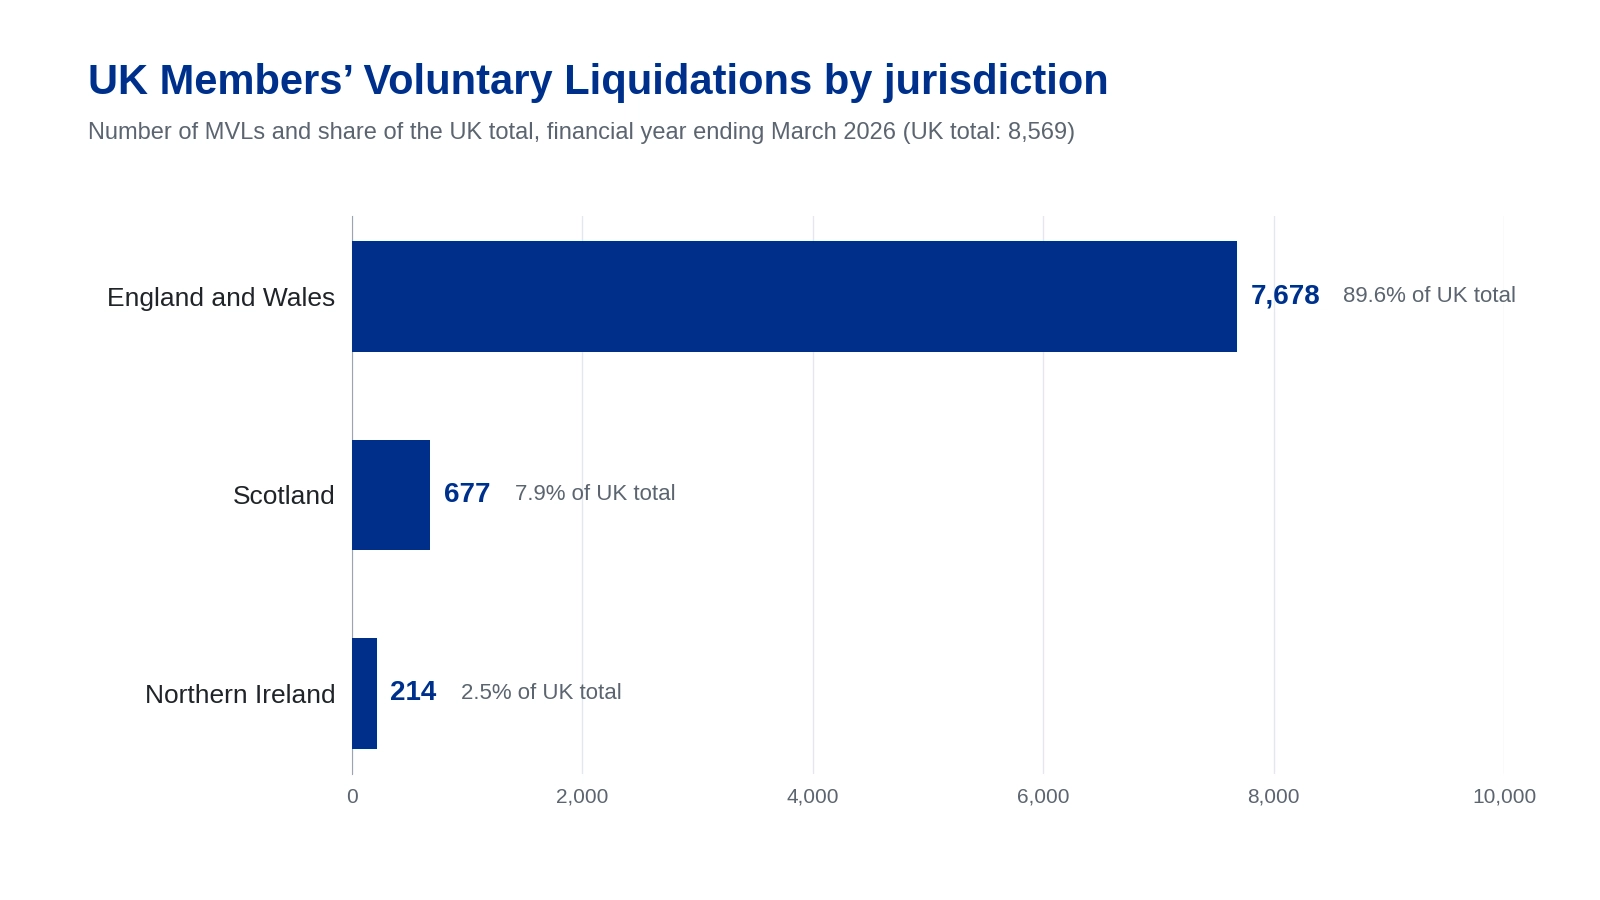
England and Wales accounted for 7,678 of the UK’s 8,569 Members’ Voluntary Liquidations in FYE 2026, equivalent to approximately 89.6% of the UK total. Scotland recorded 677 MVLs, representing 7.9%, while Northern Ireland recorded 214, representing 2.5%.

Business Asset Disposal Relief statistics

Business Asset Disposal Relief can apply to qualifying business disposals, including some distributions made through Members’ Voluntary Liquidations.

BADR statistics cover a much wider range of qualifying disposals than MVLs alone, so BADR taxpayer numbers should not be treated as MVL volumes.

What is the current Business Asset Disposal Relief rate?

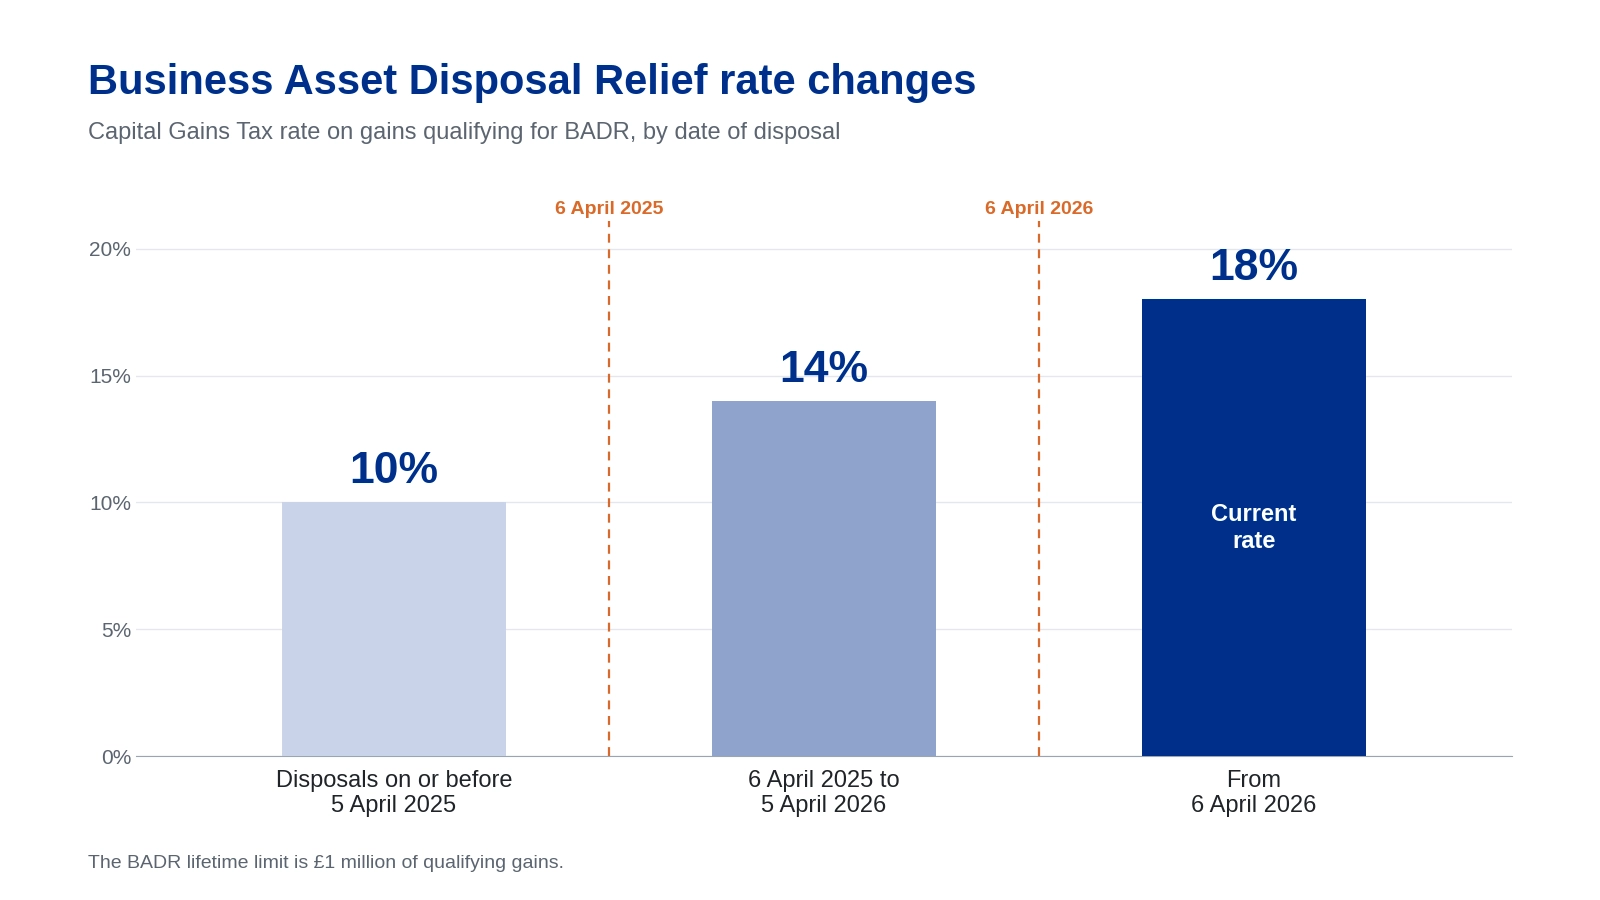
The Business Asset Disposal Relief rate is 18% for qualifying disposals made from 6 April 2026, up from 14%.

The rate was 10% for qualifying disposals made before 6 April 2025 and 14% for disposals made between 6 April 2025 and 5 April 2026.

The BADR lifetime limit remains £1 million.

How many MVLs qualify for Business Asset Disposal Relief?

There is no published figure showing how many Members’ Voluntary Liquidations qualify for Business Asset Disposal Relief.

BADR applies to a wider range of qualifying business disposals, so the number of BADR taxpayers cannot be used as a count of MVLs. Eligibility also depends on whether the relevant conditions for the relief are met.

How many people use Business Asset Disposal Relief?

Around 61,000 taxpayers made Business Asset Disposal Relief eligible disposals in the 2024/25 tax year, up approximately 45% from the previous year. This was around 19,000 more taxpayers than in 2023/24.

How much are BADR qualifying gains worth?

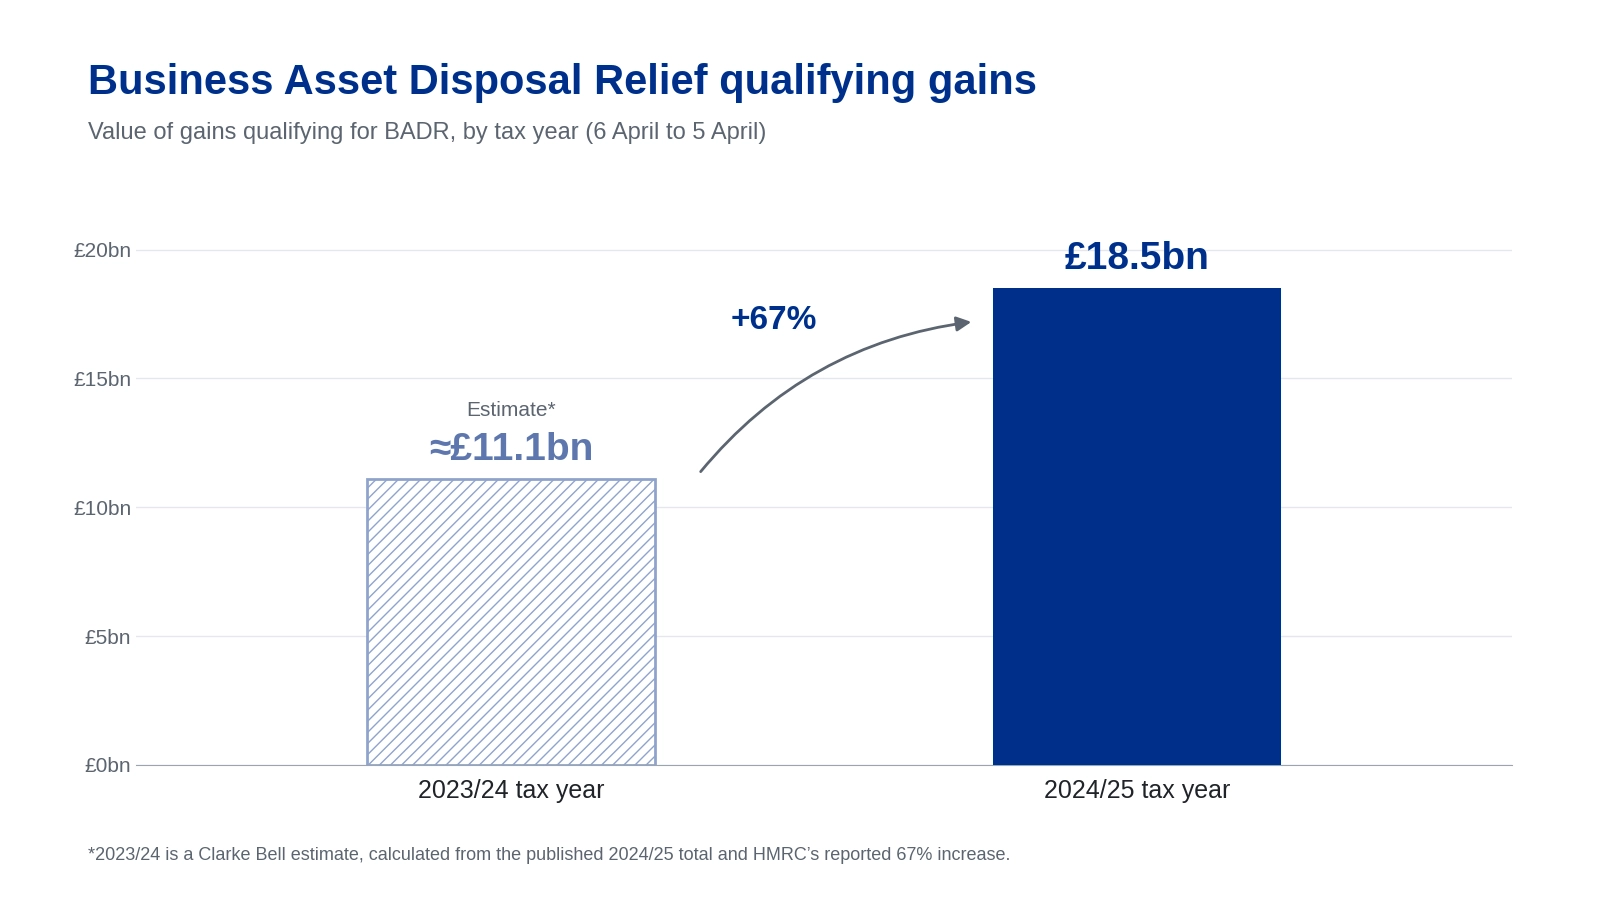
Business Asset Disposal Relief applied to £18.5 billion of qualifying gains in 2024/25, up 67% from the previous year.

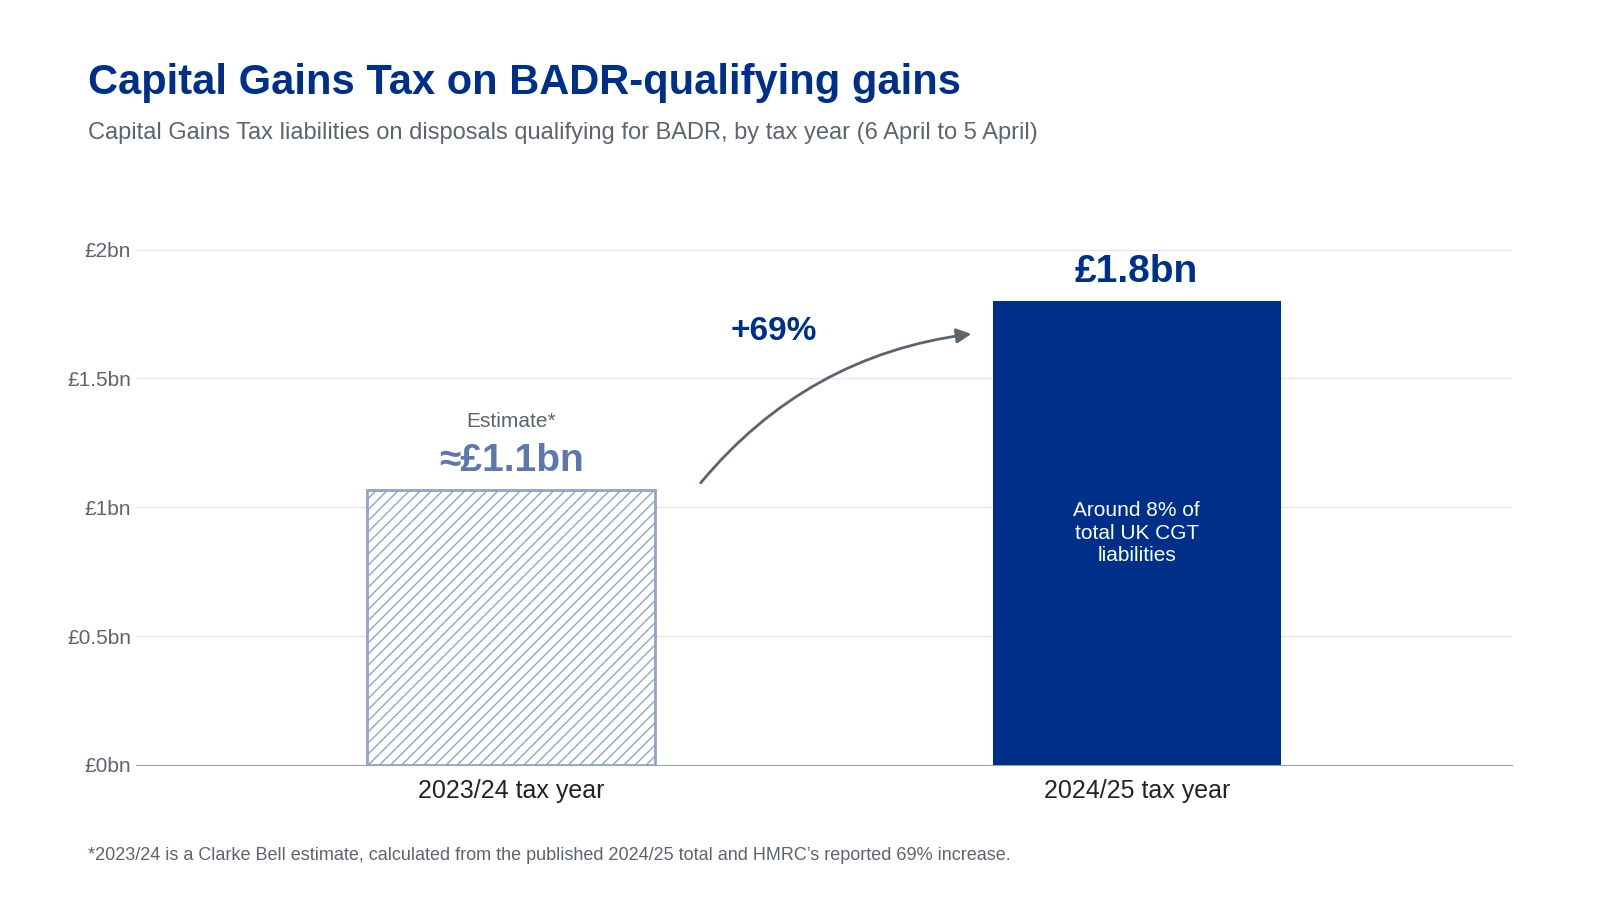
Those qualifying disposals generated around £1.8 billion in Capital Gains Tax liabilities, an increase of 69% year on year. BADR-related liabilities accounted for around 8% of total UK CGT liabilities in 2024/25.

What is the average BADR qualifying gain?

The average Business Asset Disposal Relief qualifying gain was approximately £303,000 per taxpayer in 2024/25, based on £18.5 billion of qualifying gains across around 61,000 taxpayers.

This is the mean average, not the median, so larger qualifying disposals increase the overall figure.

How concentrated are BADR gains among larger disposals?

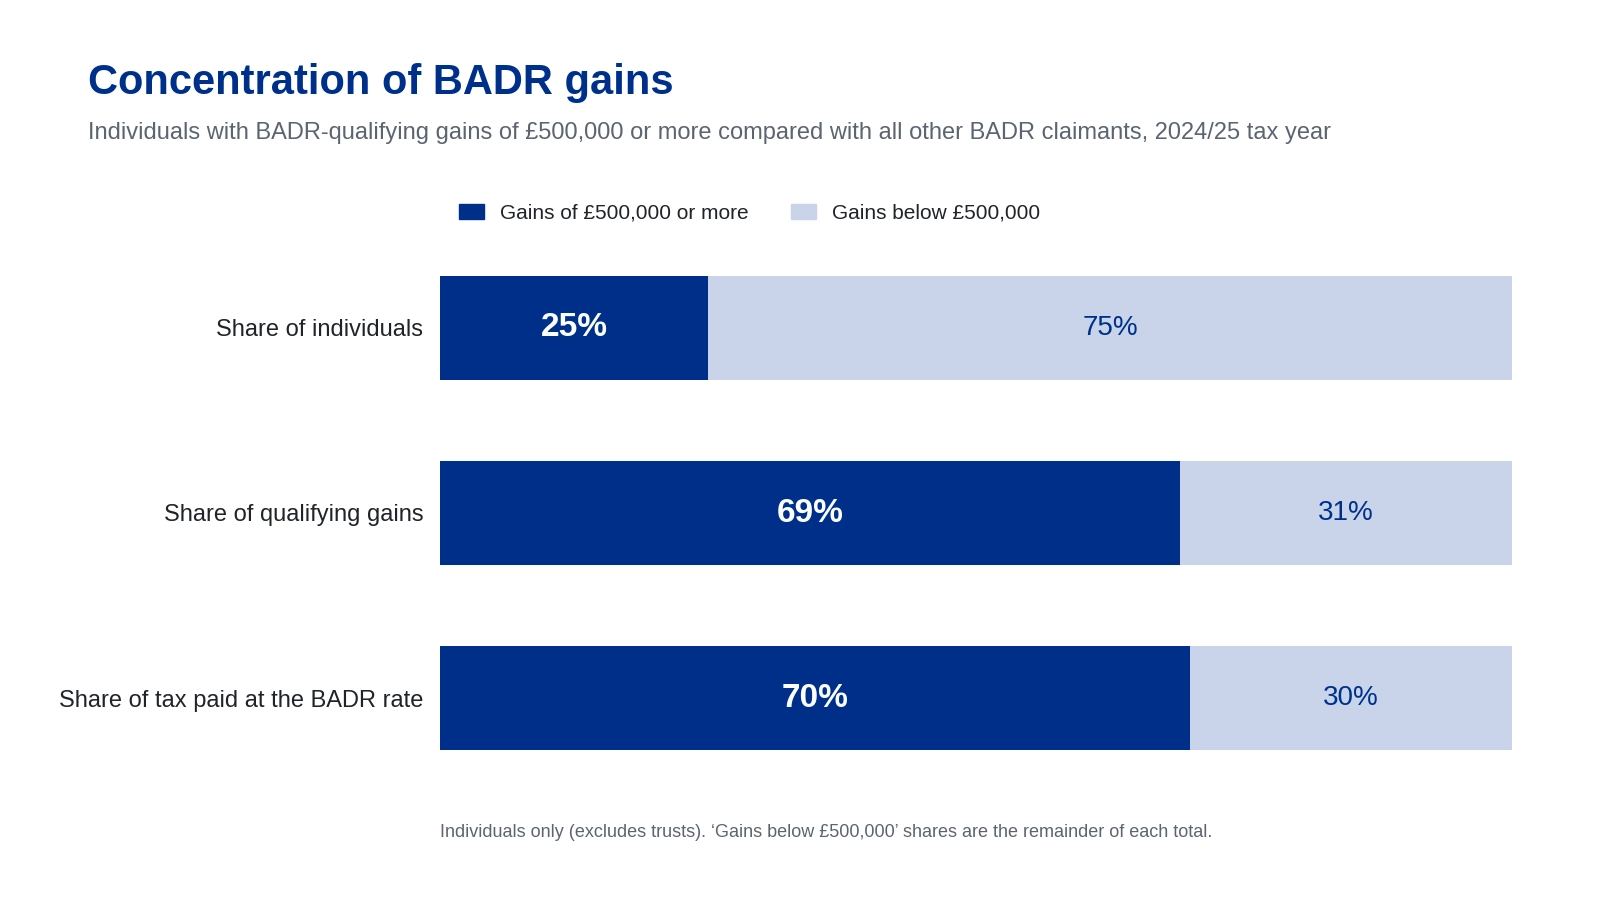
BADR gains were highly concentrated among larger disposals in 2024/25. Taxpayers with qualifying gains of £500,000 or more made up around 25% of individuals, but accounted for 69% of qualifying gains and 70% of tax paid at the BADR rate.

How much does Business Asset Disposal Relief cost the Treasury?

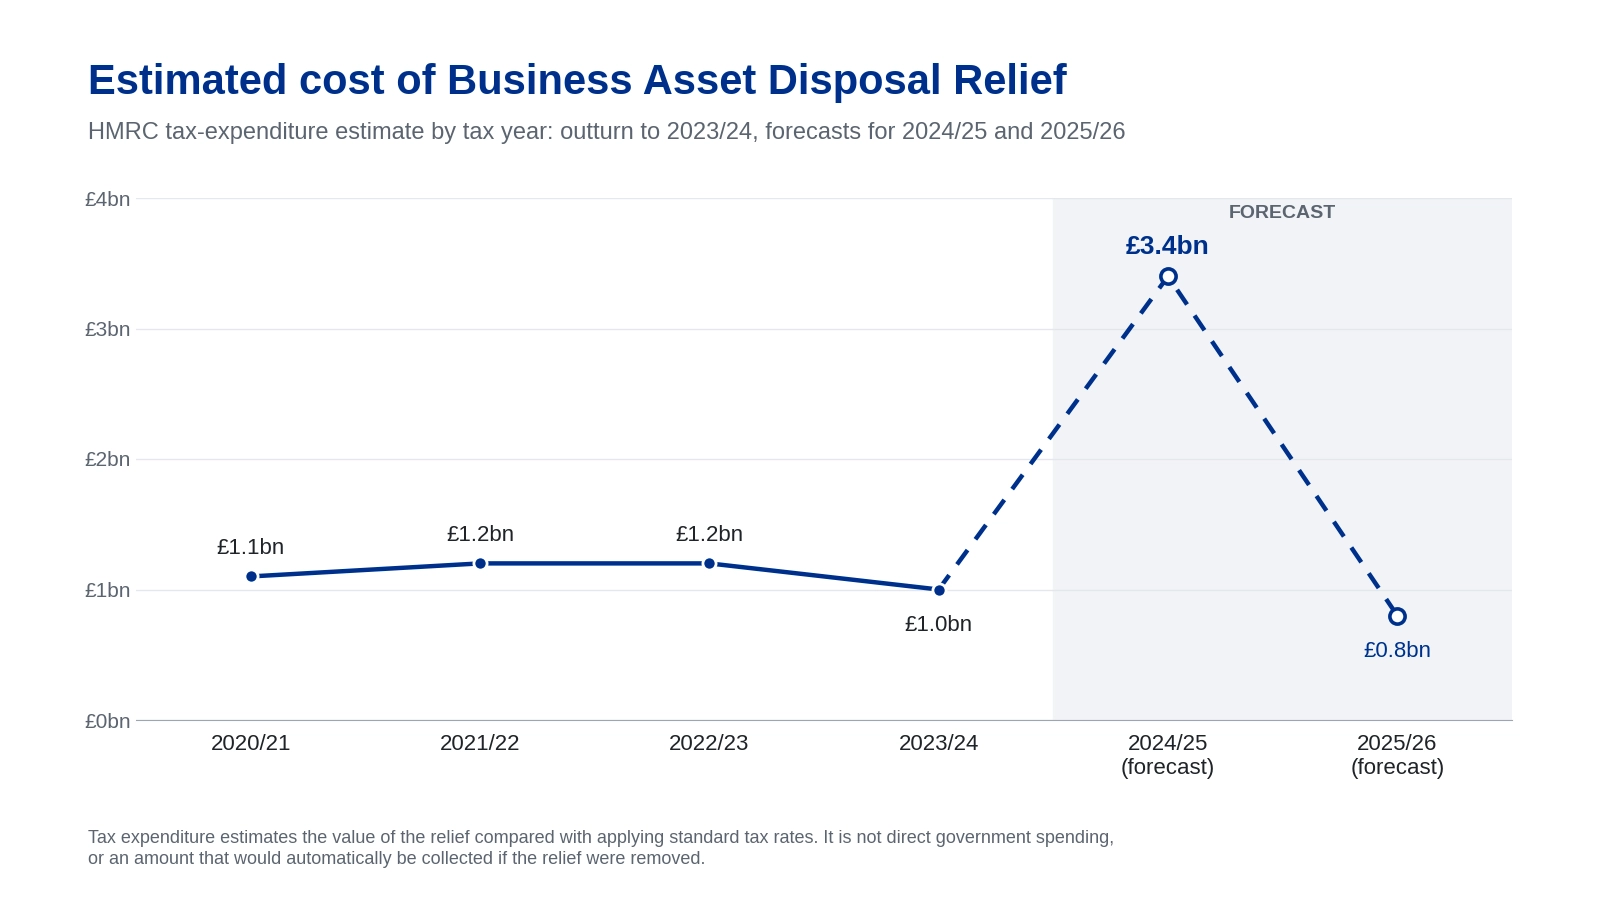
Business Asset Disposal Relief had an estimated tax-expenditure cost of £3.4 billion in 2024/25, up from £1.0 billion in 2023/24. The estimated cost is forecast to fall to around £800 million in 2025/26.

Tax expenditure is the estimated value of the relief compared with standard tax rates. It is not the same as direct government spending or the additional tax revenue that would have been collected if the relief had not existed.

How much does Business Asset Disposal Relief cost the Treasury?

Business Asset Disposal Relief had an estimated tax-expenditure cost of £3.4 billion in 2024/25, up from £1.0 billion in 2023/24. The estimated cost is forecast to fall to around £800 million in 2025/26.

Tax expenditure is the estimated value of the relief compared with standard tax rates. It is not the same as direct government spending or the additional tax revenue that would have been collected if the relief had not existed.

MVL duration statistics

This section covers the latest MVL duration statistics, including how long Members’ Voluntary Liquidations typically take, how many last several years and whether completion times are changing.

How long does a Members’ Voluntary Liquidation take?

A completed Members’ Voluntary Liquidation takes a median of 478 days, or around 16 months, from the winding-up resolution to formal dissolution.

The average duration is 601 days, while just 24% of completed MVLs finish within 12 months. The most common completion time is 12 to 18 months.

How many MVLs take more than three years?

Around 10% of completed MVLs take longer than three years to reach formal dissolution.

The longest completed MVL in the study lasted 3,786 days, or more than 10 years, while the shortest took 148 days.

Are MVLs getting faster?

Some signs suggest that completed MVLs may be getting faster, but the latest figures are inconclusive.

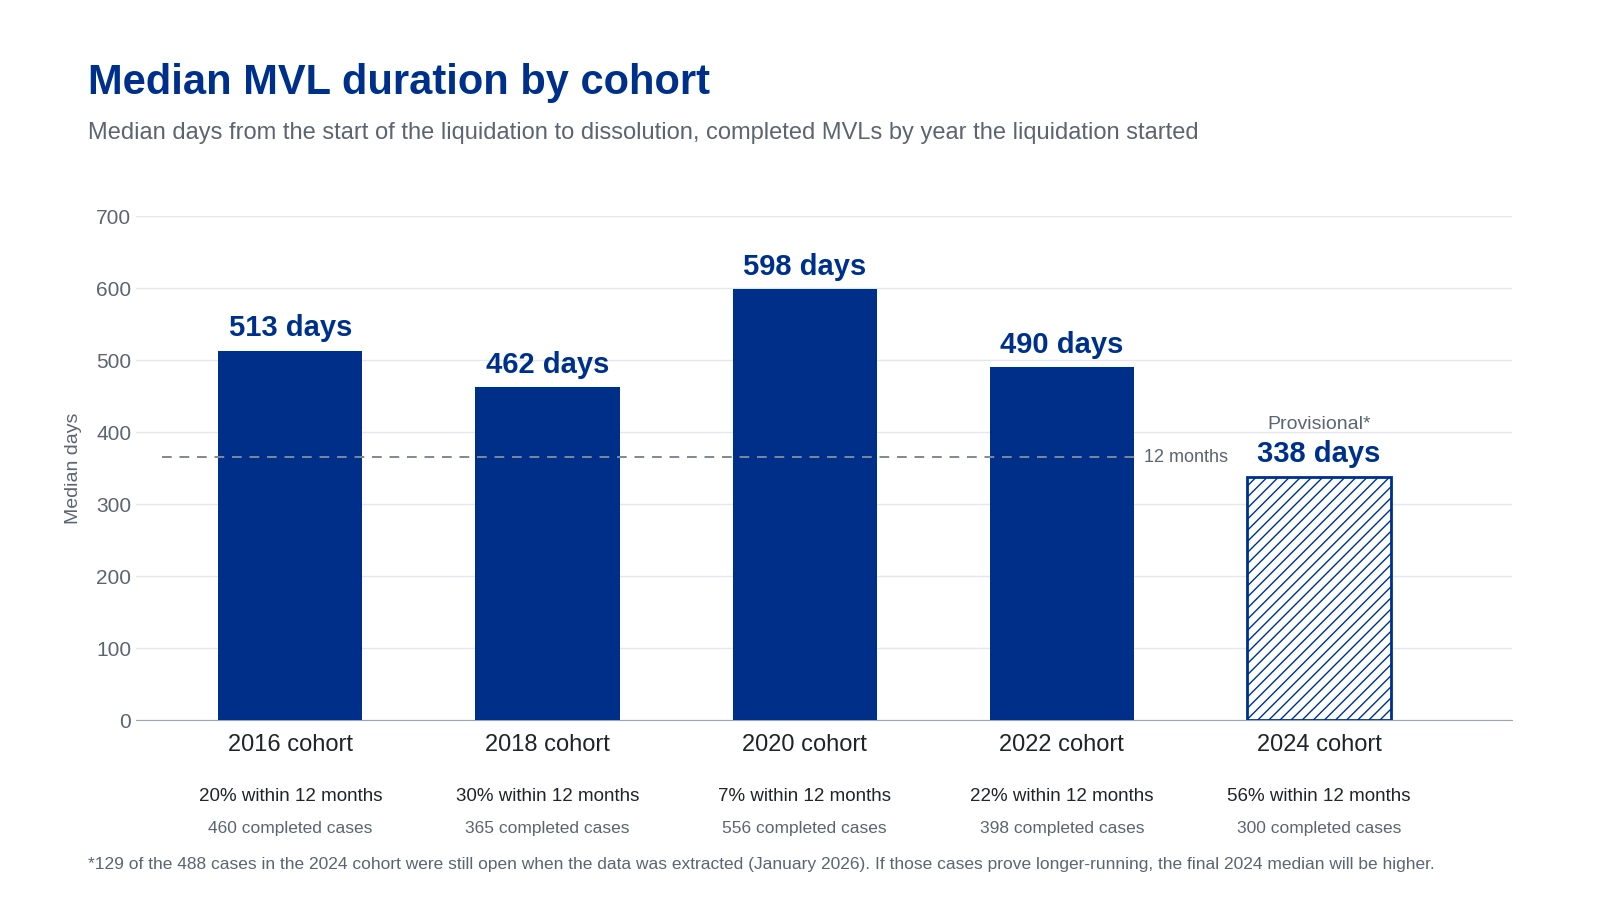
The median duration for completed MVLs in the 2024 cohort was 338 days, compared with 513 days for 2016 and 598 days for 2020.

However, many 2024 cases were still open when the research was conducted, so the shorter duration should not yet be taken as evidence that all modern MVLs are completing faster.

MVL cost statistics

This section covers the latest MVL cost statistics, including typical fees, how charges are structured and whether longer MVLs tend to cost more.

How much does an MVL cost?

The median cost of a Members’ Voluntary Liquidation is 1.8% of the assets realised.

Around 75% of eligible MVLs cost less than 4% of realised assets, although the final cost will depend on case complexity and the fee structure used.

How much do Insolvency Practitioners charge for an MVL?

Median insolvency practitioner remuneration in the large-scale MVL study was £2,750, while mean remuneration was £4,602. Median pre-appointment costs were £1,500, compared with a mean of £2,097.

How are MVL fees normally charged?

Around 72% of Members’ Voluntary Liquidations use fixed-fee remuneration, compared with 26% using time-and-rate charging and around 2% using hybrid or percentage-based arrangements.

Do longer MVLs cost more?

There was effectively no statistical relationship between the duration of a Members’ Voluntary Liquidation and its cost as a percentage of assets realised. The correlation was 0.007, with a p-value of 0.75 across 1,742 eligible cases.

MVL creditor statistics

This section covers the latest MVL creditor statistics, including how often creditors are paid in full, how quickly they are repaid, and how many MVLs have no creditor debt.

What percentage of MVL creditors are paid in full?

99.8% of eligible completed Members’ Voluntary Liquidations achieved full creditor recovery. Among cases with positive creditor balances, 664 of 667 (99.6%) paid creditors in full.

How quickly are creditors paid in an MVL?

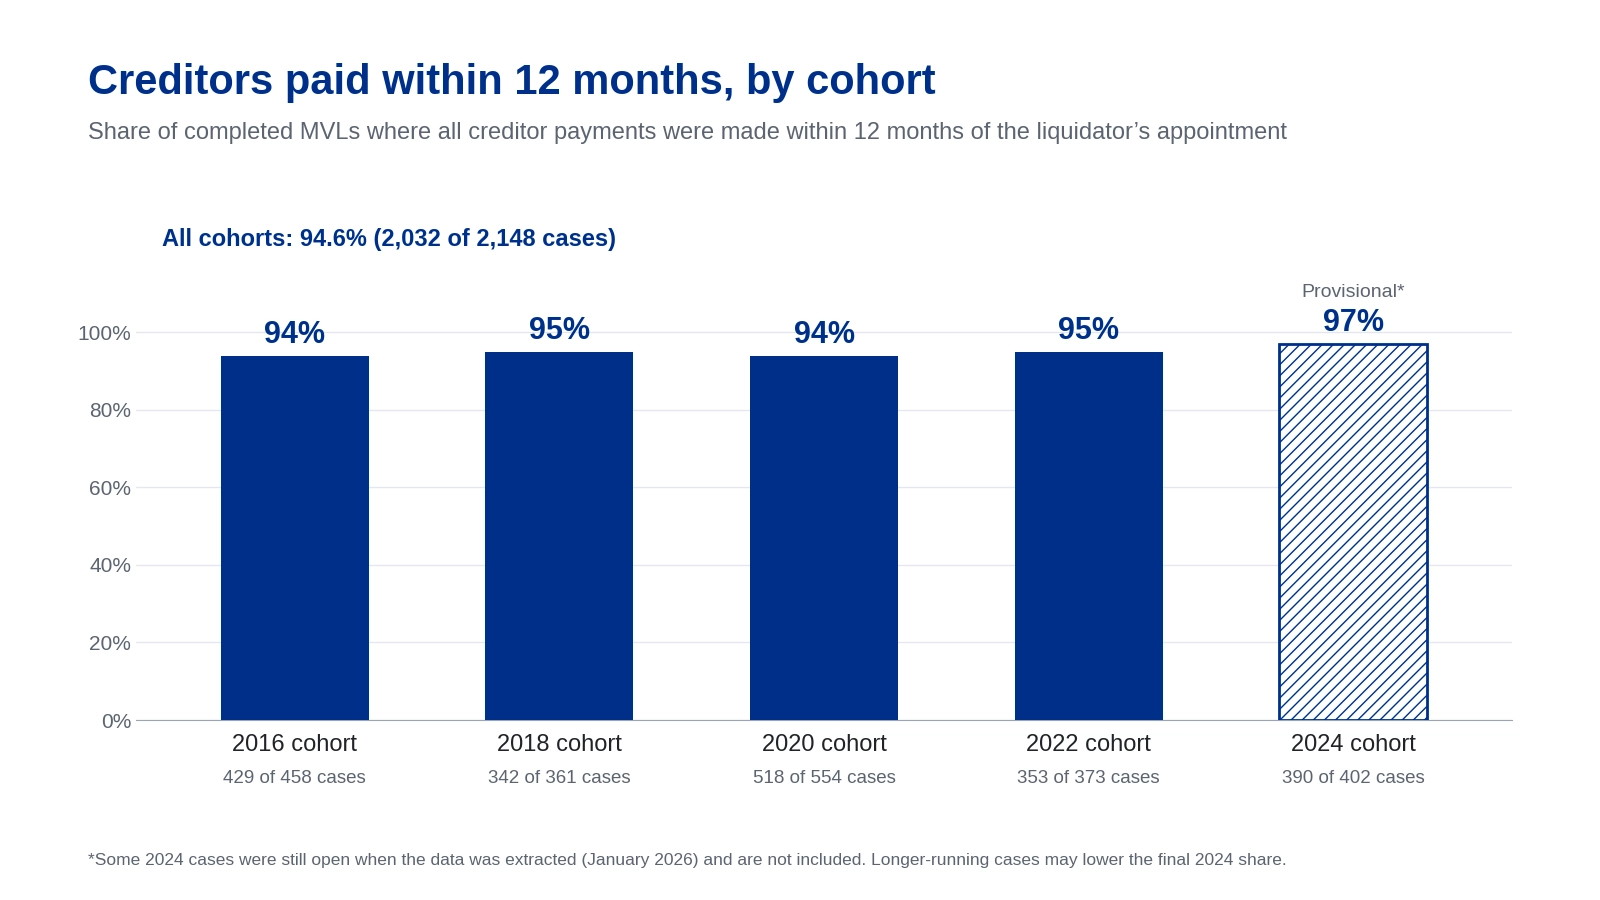
Around 94.6% of eligible Members’ Voluntary Liquidations paid creditors in full within 12 months, with 2,032 cases achieving full payment within that period.

How quickly are creditors paid in an MVL?

Around 94.6% of eligible Members’ Voluntary Liquidations paid creditors in full within 12 months, with 2,032 cases achieving full payment within that period.

How often does an MVL become a CVL?

Only 7 of 2,309 Members’ Voluntary Liquidations converted into Creditors’ Voluntary Liquidations, equivalent to approximately 0.3% of cases.

MVL shareholder statistics

This section covers the latest MVL shareholder statistics, including typical distributions, how final payouts compare with initial estimates and what shareholders commonly receive through an MVL.

How much money is typically distributed through an MVL?

The median total distribution to members was £127,552 in the 2,309-case England and Wales study. This is the median for the study sample, not a figure for every UK MVL.

Do shareholders normally receive what was predicted in an MVL?

The median final distribution to members was 100% of the amount estimated in the Declaration of Solvency. Around 62% of eligible cases finished within 99%-101% of the original estimate.

MVL asset statistics

This section covers the latest MVL asset statistics, including common asset types, distributions in specie, Overdrawn Directors’ Loan Accounts and other financial issues found in MVLs.

What assets and financial issues commonly appear in MVLs?

Members’ Voluntary Liquidations frequently involve more than cash. Around 44% of the 2,309 cases studied involved a distribution in specie, while 23.4% involved an Overdrawn Directors’ Loan Account.

The median distribution in specie was £65,643, while the median Overdrawn Directors’ Loan Account was £100,885.

How many MVLs involve cryptocurrency?

No cryptocurrency assets were identified across the 2,309 MVLs included in the large-scale England and Wales study. That does not mean cryptoassets can never be held by a company entering MVL. It means none were identified in this particular study sample.

MVLs vs insolvency and company dissolution

This section compares MVLs, insolvency and company dissolution, including the key differences between solvent and insolvent liquidations and how their latest UK volumes compare.

Is an MVL an insolvency?

No. A Members’ Voluntary Liquidation is solvent. It is used to wind up a company that can pay its debts in full. Standard monthly company insolvency statistics exclude solvent company closures such as MVLs.

What is the difference between an MVL and a CVL?

A Members’ Voluntary Liquidation is used to close a solvent company. In contrast, a Creditors’ Voluntary Liquidation is used when a company is insolvent and cannot pay its debts in full.

In an MVL, creditors are expected to be repaid in full. In a CVL, the company does not have enough assets to settle all of its debts.

What percentage of UK liquidations are MVLs?

Members’ Voluntary Liquidations accounted for approximately 26.7% of UK solvent and insolvent liquidations in FYE 2026.

There were 8,569 MVLs compared with 23,488 insolvent liquidations, which is approximately 2.7 insolvent liquidations per MVL.

MVLs involve solvent companies, while insolvent liquidations involve companies that cannot pay their debts in full.

How many insolvent liquidations are there compared with MVLs?

There were 23,488 insolvent liquidations in FYE 2026, compared with 8,569 Members’ Voluntary Liquidations. That means there were around 2.7 insolvent liquidations for every MVL.

Are company dissolutions the same as MVLs?

No. A company dissolution and a Members’ Voluntary Liquidation are different ways of closing a company.

A dissolution removes a company from the Companies House register, while an MVL is a formal liquidation process used to close a solvent company.

In FYE 2026, there were 787,120 company dissolutions, compared with 8,569 MVLs.

UK MVL statistics methodology

Our original analysis covers 21,839 confirmed MVL winding-up resolutions from 1 January 2024 to 30 September 2026, along with a separate dataset of 3,100 resolutions from 2023.

The research is based on publicly available statutory records of Members’ Voluntary Liquidations. We analyse the date on which the winding-up resolution was passed rather than the later publication date.

Working days are Monday to Friday, excluding England and Wales bank holidays. For the 2025 and 2026 BADR analyses, January of the same year is used as the main baseline. For the 2024 Autumn Budget analysis, the baseline covers the period from 1 August to 8 November 2024.

The datasets were cleaned and deduplicated before analysis. As part of our quality checks, 200 records were manually reviewed against their original statutory notices, with no discrepancies identified.

The findings should be interpreted as an analysis of timing rather than causation. The data shows when MVL resolutions were passed, but not why an individual shareholder chose to liquidate or what tax treatment ultimately applied.

Recent September 2026 figures remain provisional because there can be a delay between a resolution being passed and the corresponding public record becoming available.

Sources

Companies House, The Gazette, The Insolvency Service, HMRC Capital Gains Tax statistics, HMRC Business Asset Disposal Relief guidance, HMRC Tax Relief Statistics, Office for National Statistics Business Demography.